
ab testing的定义,control group与group with testing feature中,分成两组,来统计人们的反馈进行测试比较.
个人用笔记…写的很杂,我猜除我以外的人看不懂,记着记着就成英文的了(…).
intro
什么不能做ab testing:
- 需要测试的事件时间过长的feature.
- 对并不存在的事件进行测试(可以比较已有的两种方案,但是无法统计未有的第三种方案反馈).
什么适合做ab testing:
- clear control and clear metrics.
- can give out repeatable results.
metric choice
(a method of measuring something, or the results obtained from this)
click through rate
#of clicks / #of page viewsclick through probabilty
Unique visitors who click / Unique visitors to page
一个是couting点击数,一个是couting访问人数.
Aside:binomial distruibution
mean = N * p
standard deviation = sqrt(N * p * (1-p))
standard error = sqrt(p * (1-p) / N)
eg.
We have N = 2000, with x = 300, find confidence level = 99%
sol.
Phat(estimated probability) = 300/2000 = 0.15
m(margin of error) = z-value(for 99%) * standard error(sqrt(p * (1-p) / N))
=> 2.58 * sqrt(0.15 * 0.85 / 2000)
=> 0.021
=> P = 0.15 +- 0.021
hypothesis testing
null hypothesis(baseline): (例子)假设我们的改变方案不会影响任何人们的反馈(control group和experimental group没有区别).
alternative hypothesis: 我们想要的变化反馈.
pooled standard error
将control group和experimental group结合在一起的方法.
our data: Xcont Xexp Ncont Nexp
P pool hat = (Xcont + Xexp) / (Ncont + Nexp)
SE pool = sqrt(P pool hat * (1 - P pool hat) * (1/Ncont + 1/Nexp))
d hat(different) = P exp hat - P cont hat
(practical significance level - mim detectable effect)
m(margin of error) = pool standard error * 1.96
For null hypothesis: d = 0, d hat ~ N(0,SEpool)
If d hat > 1.96 * SE pool or d hat < -1.96 * SE pool, reject null
sampling
eg. how many page views do we need(in each group)
a = P(reject null | null true)
b = P(fail to reject | null false)
small sample : a low, b high
sensitivity = 1 - b(in general, we want experiment to have a high level of sensitivity at the partical significance boundary, often 80%)
larger sample : a same, b lower
online calculator for sample size
https://www.evanmiller.org/ab-testing/sample-size.html
policy and ethics for experiment
因为作为sample的基本都是人(纸上谈兵数学人很可能会忽视),所以得有实验前提和准则.
- Risk. what risk is the participant being exposed to
- Benefit. what benefits might be the outcome of study
- Choice. what other choices do participants have
- Privacy(data sensitivity). what expectation of privacy and confidentiality do participants have
Aside: 关于匿名.为确保匿名后的data还能互相分辨,会加入time stamps(one of HIPAA 18 identifiers).
Anonymous data: data without any personally identifiable infomation.
Anonymized data: identified or anonymous data that has been looked at and guaranteed in some way that the re-identification isk is now to non-existent.
Note: 虽然没有写名字,但一些info(timestamp也可能行)还是能idenfity个人(AOL search data leak例子), may still have high re-identificaiton risk.
metric
sanity check metrics
evaluation metrics
external data(data collected by ppl outside of your company)
gather own in-depth data(Retrospective, User Experience Research, focus groups and surveys)
User Experience Research: Go depth with few users. Good for brainstorming. Can use special equipment. Want to valid result.
Focus group: more participants less depth. Get feedback on hypotheticals. Run the risk of group think.
Surveys: Useful for metrics you cannot measure yourself. Cannot directly compare to other results.
Human evaluation: pay human raters to evaluate.
compute data from metric
1st: what data to look at when actually compute the metric.
2rd: given those events, how to summarize metric.
-> building intuition about your metric.
Define a metric:
for example click-though-probability = (# of users who click)/(# of users who visit)
Def#1: For each
Def#2: Create unique ID for each page view -> (#pageviews w/click within
Def#3: (# clicks)/(#pageviews) -> click-though-rate
Possible situation to think about:
- double click
- back button cashes page(page reload)
- click-tracking bug
Aside: Segmenting and filtering data
data的归类和分析(比如说week over week, year over year,按地区分类,分开手机和电脑平台等).data是否bias.
general categories of metrics:
sums and counts
eg. # users who visited pagedistribution: means, medians, 25th, 75th, 90th percentiles
eg. mean age of users who completed a course
eg. median latency of page loadprobabilities and rates
probability has 0 or 1 outcome in each case
rate has 0 or moreratios
eg. P(revenue-generating click)/P(any click)
Aside: Calculating variability(variance or standard deviation && distribution)
Binomial distribution:
- SE(standard error) = sqrt(β * (1 - β) / N)
- m(margin of error) = Z(z score confidence level) * SE
| Type of metric | distribution | estimated variance |
|---|---|---|
| probability | binomial(normal) | (Phat * (1 - Phat) / N) |
| mean | normal | 𝜎 ^ 2 / N |
| median/percentile | depends | depends |
| count/difference | normal(often) | Var(x) + Var(y) |
| rates | poisson | mean |
| ratios | depends | depends |
- 𝜎 -> variants of sample
calculating variability empirically
Uses of A/A tests:
- Compare results to what you expect(sanity check)
- Estimate variance and calculate confidence
- Directly estimate confidence interval
Boot strapping
Run one experiment, take random sample from each side of experiment and calculate as it were a full experimental group, use as simulated experiment. Repeat. Use the result as if run multiple experiments.
confidence interval(z = 1.96) vs empirical confidence interval: empirical去掉最高和最低就是interval balance.
注: empirical最好有more than 40 experiments to be confident.
designing an experiment
Unit of diversion
how we define what an individual subject is in the experience.
Commonly used:
- User id (user name, email address, phone number)
- stable, unchanging
- personally identifiable
- Anonymous id (cookie)
- changes when you switch browser or device
- users can clear cookies(easy to change)
- Event
- no consistent experience(for the change that is not user visible)
- use only for non-user-visible changes
Less common:
- Device id
- only available for mobile
- tied to specific device
- unchangeable by user
- IP address
- changes when location changes
Example: unit of diversion (check means assigned to a group)
| (desktop) homepage | sign in | visit class | watch video | (mobile) auto sign in | watch video | |
|---|---|---|---|---|---|---|
| user-id | None | 🍁 | ||||
| cookie | 🍁 | Note: if they did not clear their cookie | 🍁 | |||
| event | 🍁 | 🍁 | 🍁 | 🍁 | 🍁 | 🍁 |
| device id | None | None | None | None | 🍁 | |
| IP address | 🍁 | Not clear | Not clear | Not clear | Not clear | Not clear |
How we choose:
- user consistency (whether cross devices/ sign in sign off border)
- event(not necessary) > cookie(enough) > user-id(necessary)
- ethical consideration (what data is collecting/ data is identified or not)
- security and confidentiality questions
- informed consent
- variability
- unit of analysis -> whatever denominator of metric
(eg. page view if unit of analysis over click rough rate) - unit of diversion(if is cookie or user id)
(eg. same metric click through rate is much higher than unit of analysis)
why: we consider what to be independent wrong.
Event: every single event is different random draw.
Cookie & user id -> we diverting groups of events.
Population
experiment:
intra-user experiment . Expose the same user to the feature being on and off over time, analyze their behavior.
pitfall: Careful about choosing comparable time window. Frustration or learning problem.
searching ranking, preferences(rank order list): interleaved experiment . Expose same user to the A and B side at the same time. Useful for reordering list.
inter-user experiment . Different ppl from A side and B side.
cohort : try to match up the entering classes. At least have roughly the same parameter in two user groups.
(eg. In medical experiments, match up patients in trial based on demographic info, ages, medical history, then do pair analysis.)
target:
Based on info required. Restriction. Avoid overlap target.
Aside: Significance
A p-value of 5% or lower is often considered to be statistically significant.
statistically significant difference: compute difference and confidence interval and see if it includes 0.(if margin of error is wider than estimated difference -> includes 0 -> diff is not significant)
Diff between population and cohort:
population is having a whole group of users. Whichin the population define cohort -> people who enter the experiment at the same time.
(eg. divert cookie or user id, look at a particular country, during the experience could gain/lose users. Cohort: define an entering class and only look at users who entered your experiment on both sides around the same time)
cohort are harder to analyze, they will take more data because you’ll lose users. Only use they when looking for user stability.
- Looking for learning effects
- Examining user retention
- Want to increase user activity
- Anything requiring user to be established
example:
- Have existing course and change structure of lesson
- Unit of diversion: user-id(but not all users in the course)
- Control: need to be a comparable cohort
Size
based on practical significance, statistical significance.
To calculate size, assume SE ~ 1/sqrt(N)
example:
Experiment: change order of courses on course list
Metric: click-though-rate
Unit-of-diversion:cookies
α: 0.05
β: 0.2
dmin: 0.01
SE = 0.0628/1000 pageview
Result: 300,000 -> too much
Adjusted:
- Increase dmin, α, β
- change unit of diversion to page view -> makes unit of diversion same as unit of analysis, variability of the metric will decrease and close to analytical estimate.
- target experiment to specific traffic
- change metric to cookie-based click-through-probability -> often not make a significant difference to variability
Duration
consider difference between weekdays and weekends -> run smaller percentage across multiple days, or run multiple tasks at the same time on smaller percentage of traffic
Aside: learning effects
measure user learning, whether a user is adapting to a change or not.
Sanity check
- Population sizing metrics
based on unit of diversion -> experiment population and control population are comparable - Invariants(Metrics that don’t expect to change)
example: how to figure out whether difference is within expectation(each cookie is randomly assigned to the control or experiment group with probabilty 0.5)
1.compute standard deviation of binomial with probability 0.5 we expect.
2.multiply by z-score to get margin of error.
3.compute confidence interval around 0.5 -> if control group fall within this confidence interval: experiment is setup properly.
4.check whether observed fraction is within interval.
how to solve:
- check technically issues
- retrospective analysis (endemic)
- pre and post periods
aside:
click through probability: binomial distribution
click through rate: poisson distribution
online calculator:https://www.graphpad.com/quickcalcs/binomial1.cfm
aside:
Simpson’s paradox: a trend appears in several different groups of data but disappears or reverses when these groups are combined.
tracking metrics
- single:
- hypothesis test
- sign test
hypothesis test:
SE ~ 1/sqrt(N) ->when we calculate two groups -> sqrt(1/N1 + 1/N2)
Empirical SE/sqrt(1/sample size + 1/sample size) = SE/sqrt(1/group1 size + 1/group2 size) => then we can find SE
different = rate experiment - rate control
margin of error = SE * 1.96
confidence interval = different +- margin of error
sign test:
numbers of days
numbers of days with positive change
-> if no difference, 50% of positive change on each day, we do a binomial(small) or normal(big number) check
- multiple
- 1.assume independence
- 2.bonferroni correction
independence:
α overall = (1 - α individual)^n
bonferroni correction:
α individual = α overall / # of metric
from difference and SE -> we get margin of error = SE * 1.96
if margin of error is wider than observed difference -> not statistically significant
control false discovery rate(FDR)
FDR = E[# false positives / # rejections]
🎉🎉🎉🎉🎉🎉🎉🎉🎉🎉🎉🎉🎉🎉🎉🎉🎉🎉🎉🎉🎉🎉🎉🎉🎉🎉🎉🎉🎉🎉
Example process
Experiment design
1.metric choice
choose invariant + evaluation metrics
- number of cookies
- number of user-ids
- number of clicks
- click-through-probability
- gross conversion
- retention
- net conversion
aside:
gross conversion: number of user-ids to complete checkout and enroll in the free trial divided by number of unique cookies to click the “start free trial” button
retention: number of user-ids to remain enrolled past the 14-day boundary(make at least one payment) divided by number of user-ids to complete checkout
net conversion: number of user-ids to remain enrolled past the 14-day bounday(make at least one payment) divided by the number of unique cookies to click the “start free trial” button
2.measuring standard deviation
whether or not use bonferroni correction in analysis phase
3.sizing
3.1.number of samples vs. power
3.2.duration vs. exposure
Experiment analysis
4.sanity checks
calculate lower bound, upper bound, observed
5.result analysis
5.1.effect size test
calculate lower bound, upper bound, statistical significance, practical significance
5.2.sigh tests
p-value, statistical significance
summary
state whether used bonferroni correction, why and why not.
If there are any discrepancies between the effect size hypothesis tests and the sigh test, describe the discrepancy and why think it arose.
🎉🎉🎉🎉🎉🎉🎉🎉🎉🎉🎉🎉🎉🎉🎉🎉🎉🎉🎉🎉🎉🎉🎉🎉🎉🎉🎉🎉🎉🎉
Example process-ver2.0
1.metric choice
choose invariant metrics and evaluation metric
2.measuring standard deviation
whether analytic estimate would be comparable to the empirical variability
whether expect them to be different (in which case it might be worth doing an empirical estimate if there is time)
3.sizing
3.1.number of samples vs. power
whether use Bonferroni correction during analysis phase, give number of pageviews need to power experiment appropriately
3.2.duration vs. exposure
indicate what fraction of traffic would divert to this experiment and how many days would need to run the experiment
Experiment analysis
4.sanity checks
for each of invariant metrics, give the 95% confidence interval for the value expect to observe, the actual observed value, and whether the metric passes sanity check
if not pass -> guess what went wrong based on day-by-day data
5.result analysis
5.1.effect size test
for each of evaluation metrics, give 95% confidence interval around the difference between the experiment and control groups. Indicate whether each metric is statistically and practically significant.
5.2.sigh tests
for each of evaluation metrics, do sign test using day-by-day data, report the p-value of the sign test and whether the result is statistically significant.
summary
final notes
Aside for terms:
Closed testing procedure:
a general method for performing more than one hypothesis test simultaneously.
Suppose there are k hypotheses H1,…, Hk to be tested and the overall type I error rate is α. The closed testing principle allows the rejection of any one of these elementary hypotheses, say Hi, if all possible intersection hypotheses involving Hi can be rejected by using valid local level α tests. It controls the familywise error rate for all the k hypotheses at level α in the strong sense.
wiki
Boole’s inequality
In probability theory, Boole’s inequality, also known as the union bound, says that for any finite or countable set of events, the probability that at least one of the events happens is no greater than the sum of the probabilities of the individual events.
wiki
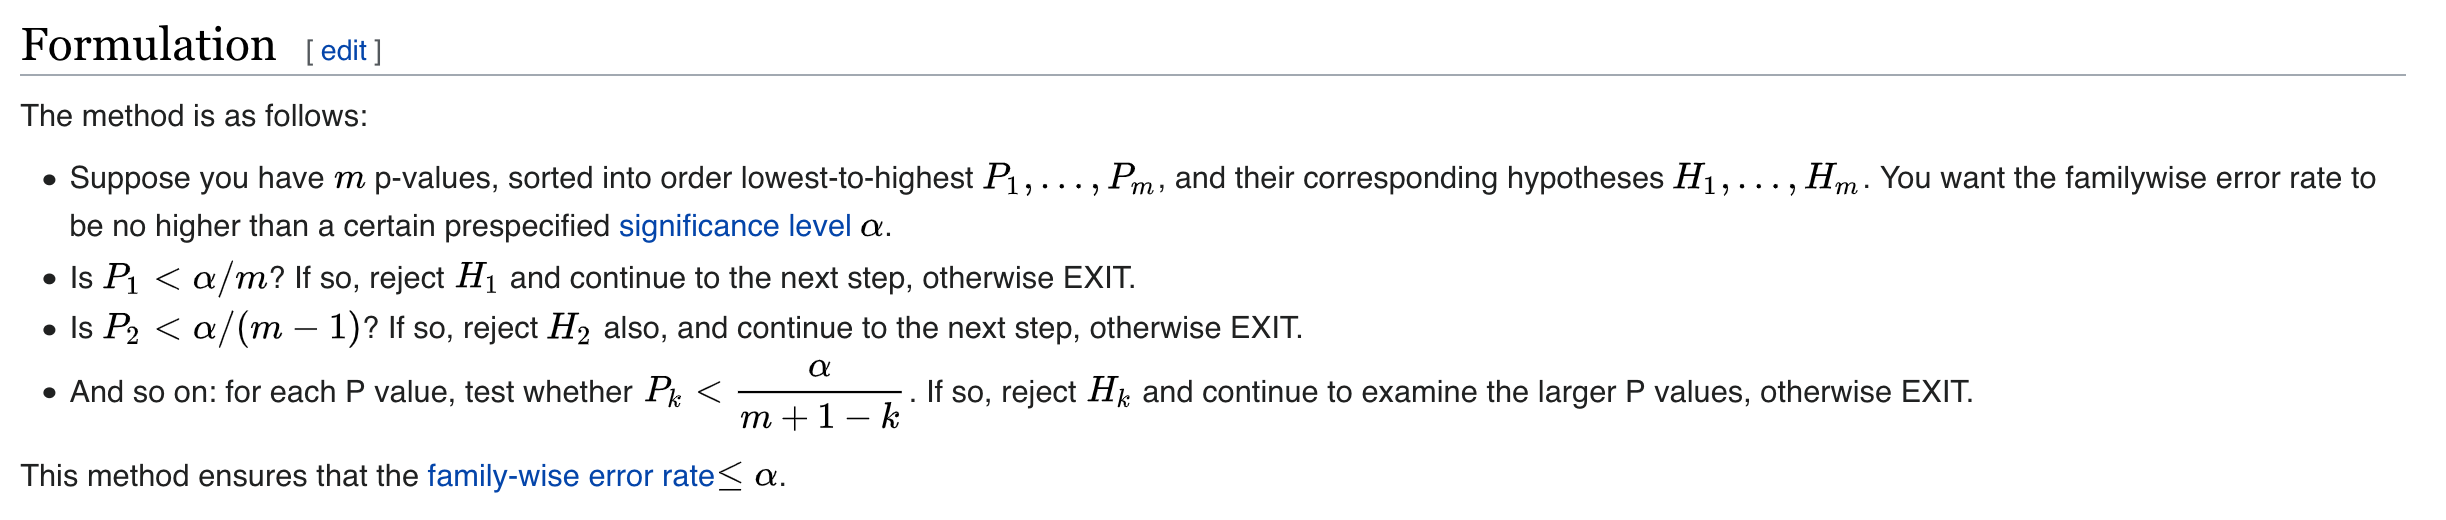
Holm–Bonferroni method
Note:
Type I error:
Erroneously rejecting the null hypothesis with a statistical analysis, then the null hypothesis is in fact true in the population.
Bonferroni correction:
An adjustment applied to p-values that is “supposed to be” applied, when two or more statistical analyses have been performed on the same sample of data.
The correction is supposed to be applied, as the familywise type I error rate is known to be larger than the per analysis error rate(eg. alpha = 0.05)
α individual = α overall / # of metric (eg. 0.05 / 3 metric = 0.017)
wiki
Familywise error rate:
The probability of committing at least one type 1 error amongst two or more statistical analyses on the same sample of data.
αFW = 1 - (1 - αPC)^c
c : number of comparisons performed
αPC : specified per contrast error rate(usually 0.05)
Multiple comparisons problem:
In statistics, the multiple comparisons, multiplicity or multiple testing problem occurs when one considers a set of statistical inferences simultaneously or infers a subset of parameters selected based on the observed values. In certain fields it is known as the look-elsewhere effect.
wiki
False discovery rate
The false discovery rate (FDR) is a method of conceptualizing the rate of type I errors in null hypothesis testing when conducting multiple comparisons.
wiki